ISSUE — FREE
Free
The open gallery.
$0forever
- 5 strategy builds / month
- 2 indicators on the chart
- 3-month backtest window
- Live price alerts
- Nexus Community — the verified network
- 1 device
No credit card required
CHARTING & QUANTITATIVE ANALYSIS SOFTWARE — SERIES 2026
Nexus Charts is charting software with a quant engine inside: every backtest re-runs through a 500-path Monte Carlo on Binance data reaching back to 2017, footprints print the order flow inside every candle, and Odiseo — an AI analyst — reads the chart beside you. English or Spanish in. Evidence out.
FREE FOREVER · NO CREDIT CARD
Traders spend weeks refining an idea, then judge it on a single run of history. Three habits of legacy charting make that worse:
A backtest is a single ordering of trades. Live markets will deal the same trades in a different order — different equity path, different drawdown, same strategy. Planning on one curve is planning on luck.
If testing an idea means learning Pine Script first, most ideas die untested. Describing the idea — in the language you actually think in — should be enough.
When charting software sells indicator slots, your analysis shrinks to fit the plan instead of the market.
Nexus was engraved against all three.
Every plate below is the real product — unretouched screenshots of the live canvas.
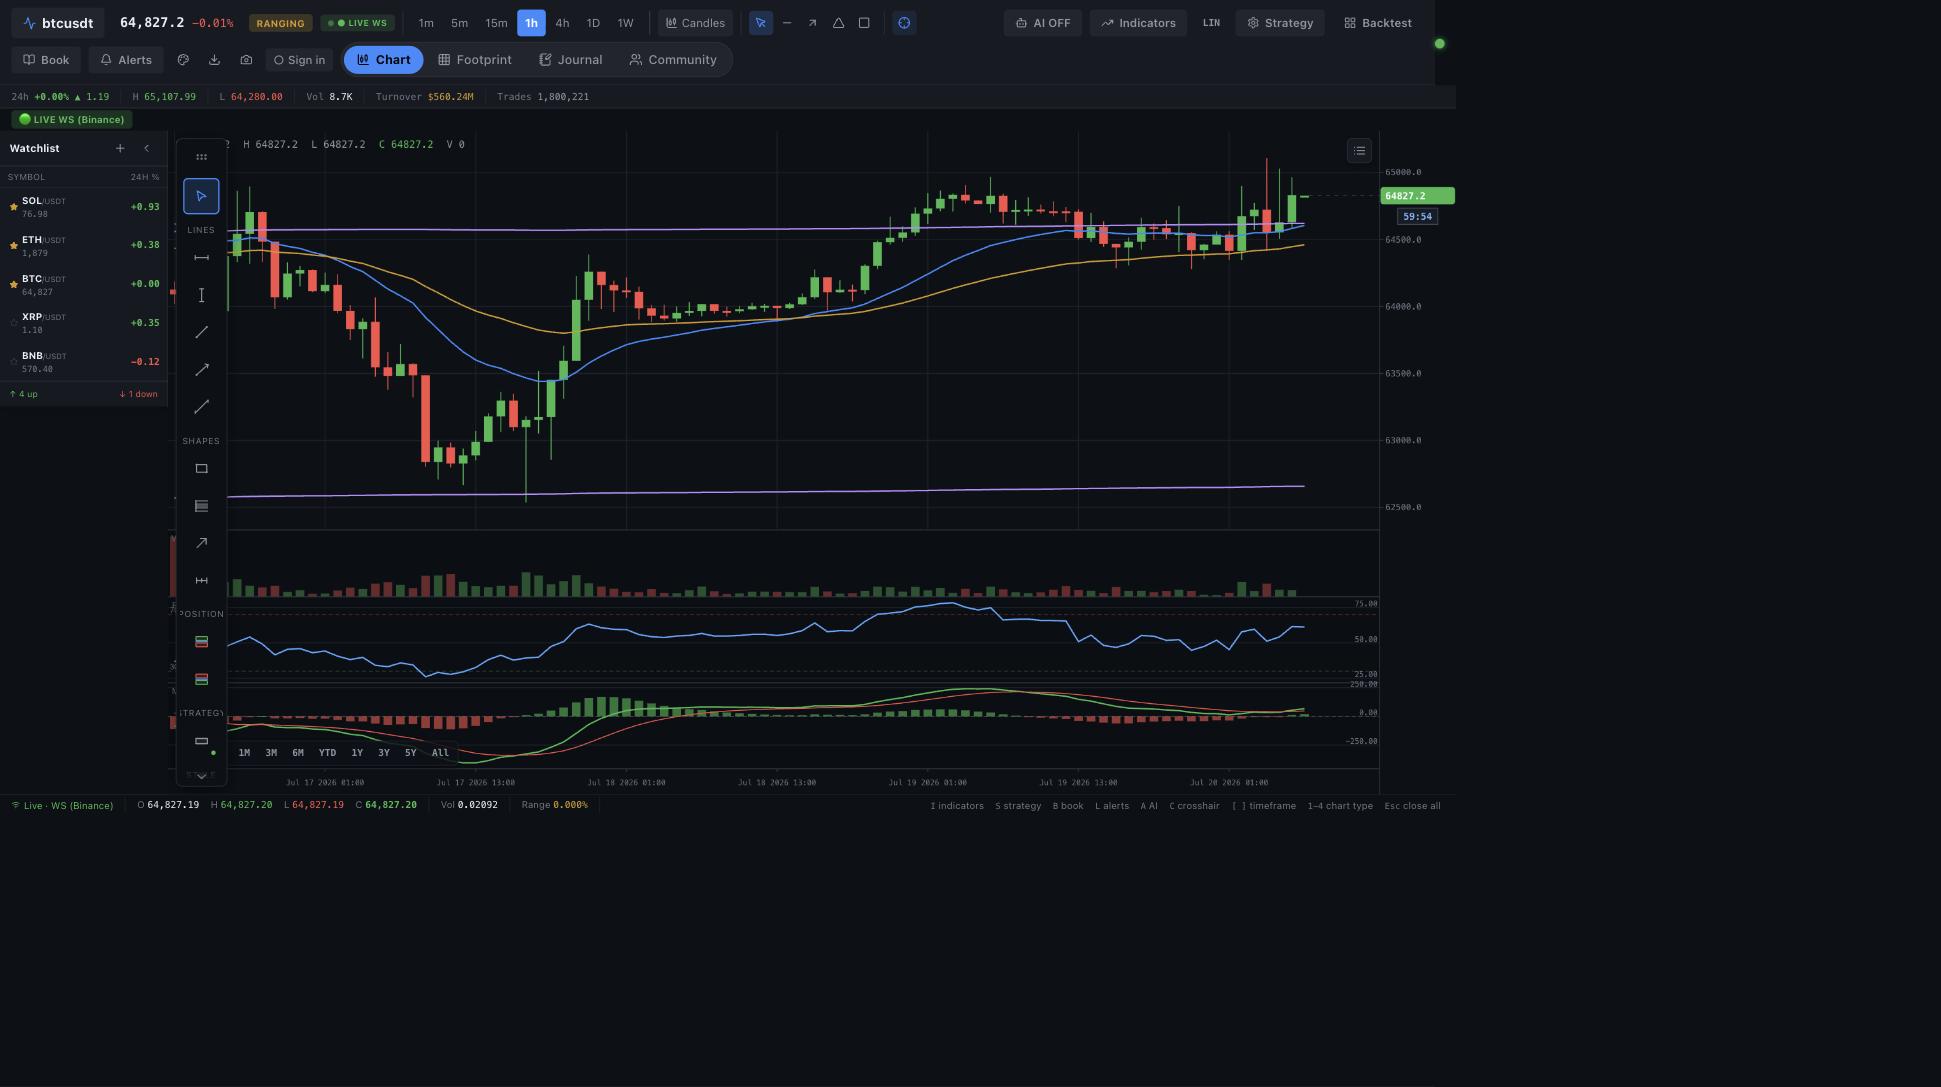
FIG. 01 — CANVAS ENGINE
A pure-Canvas renderer built from scratch — no SVG lag, no library ceiling. Pan and zoom through years of candles at 60 fps with RSI, MACD and 144 more indicators drawn in the same frame.
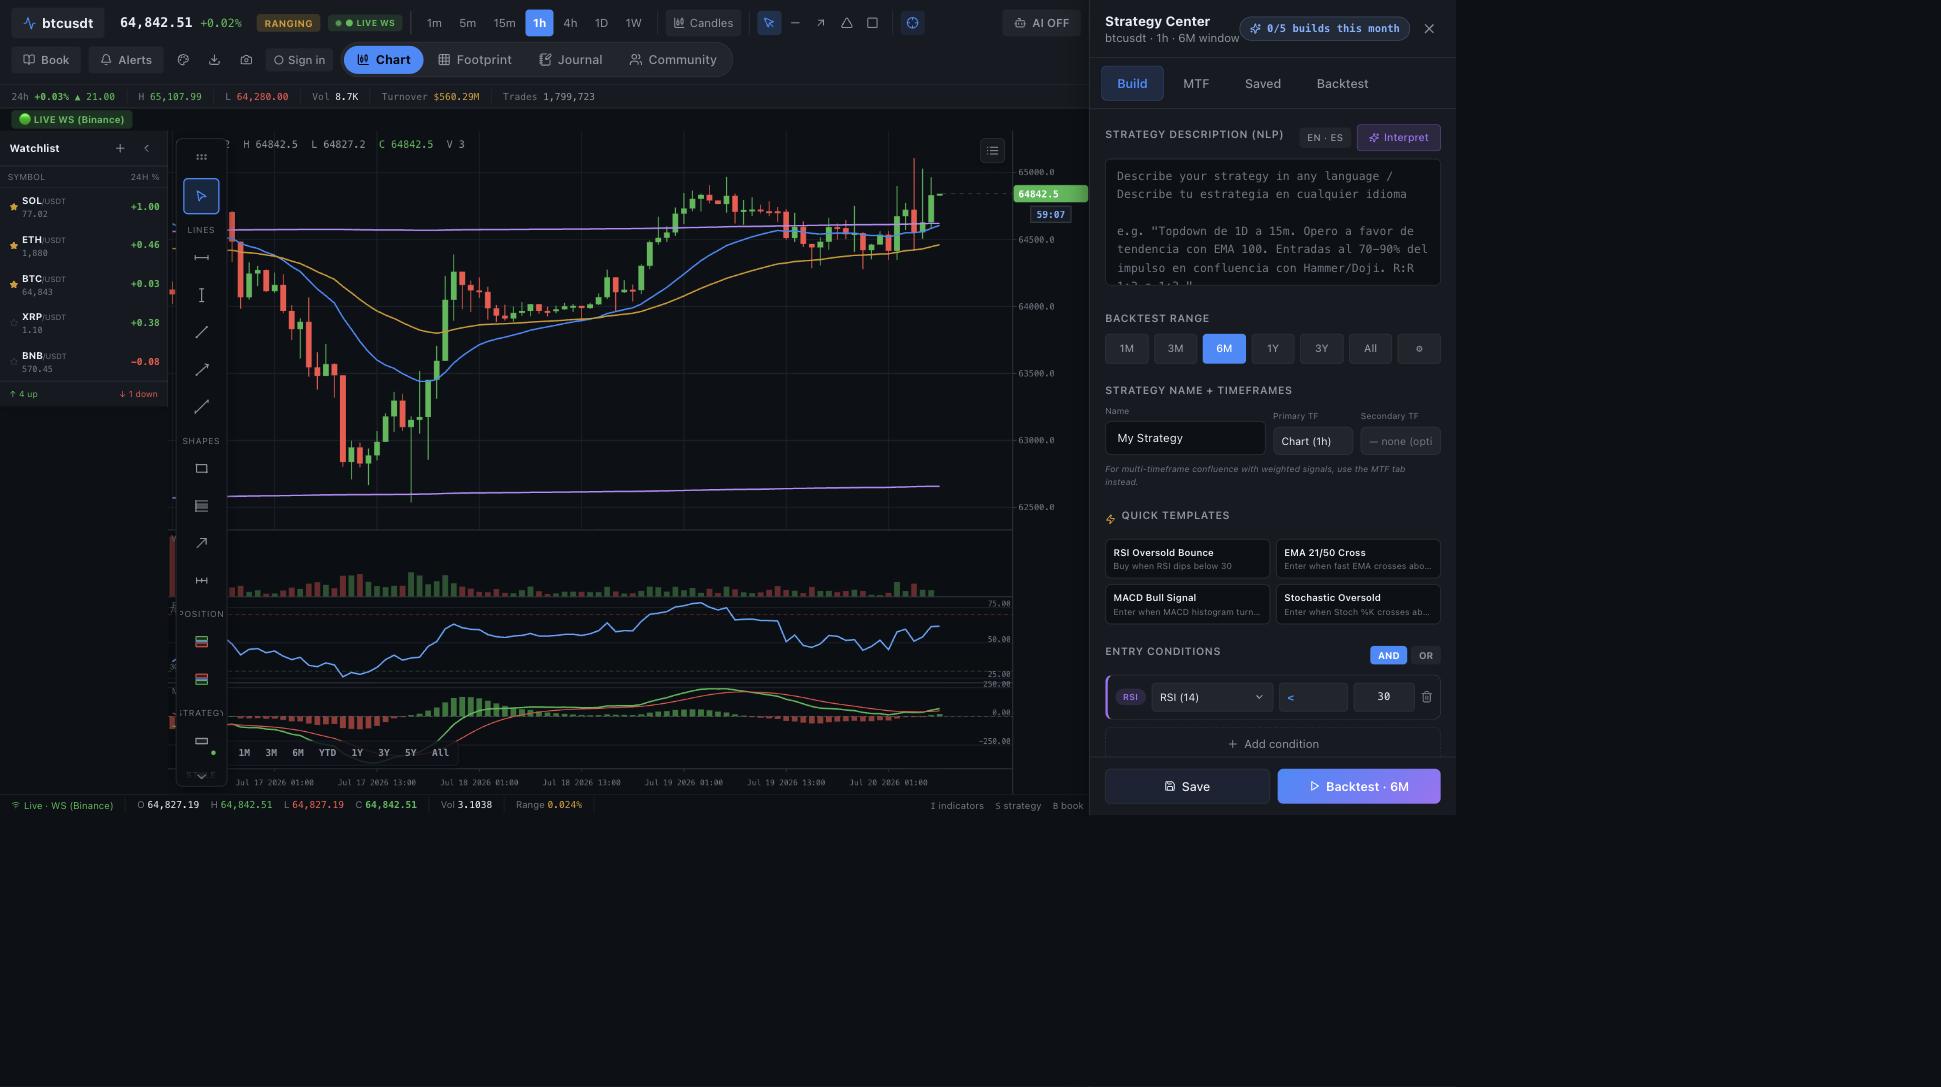
FIG. 02 — NLP STRATEGY BUILDER
“Topdown de 1D a 15m… entradas al 70–90% del impulso” — English or Spanish, the builder turns your sentence into entry conditions, exits and risk, ready to backtest in under a second.
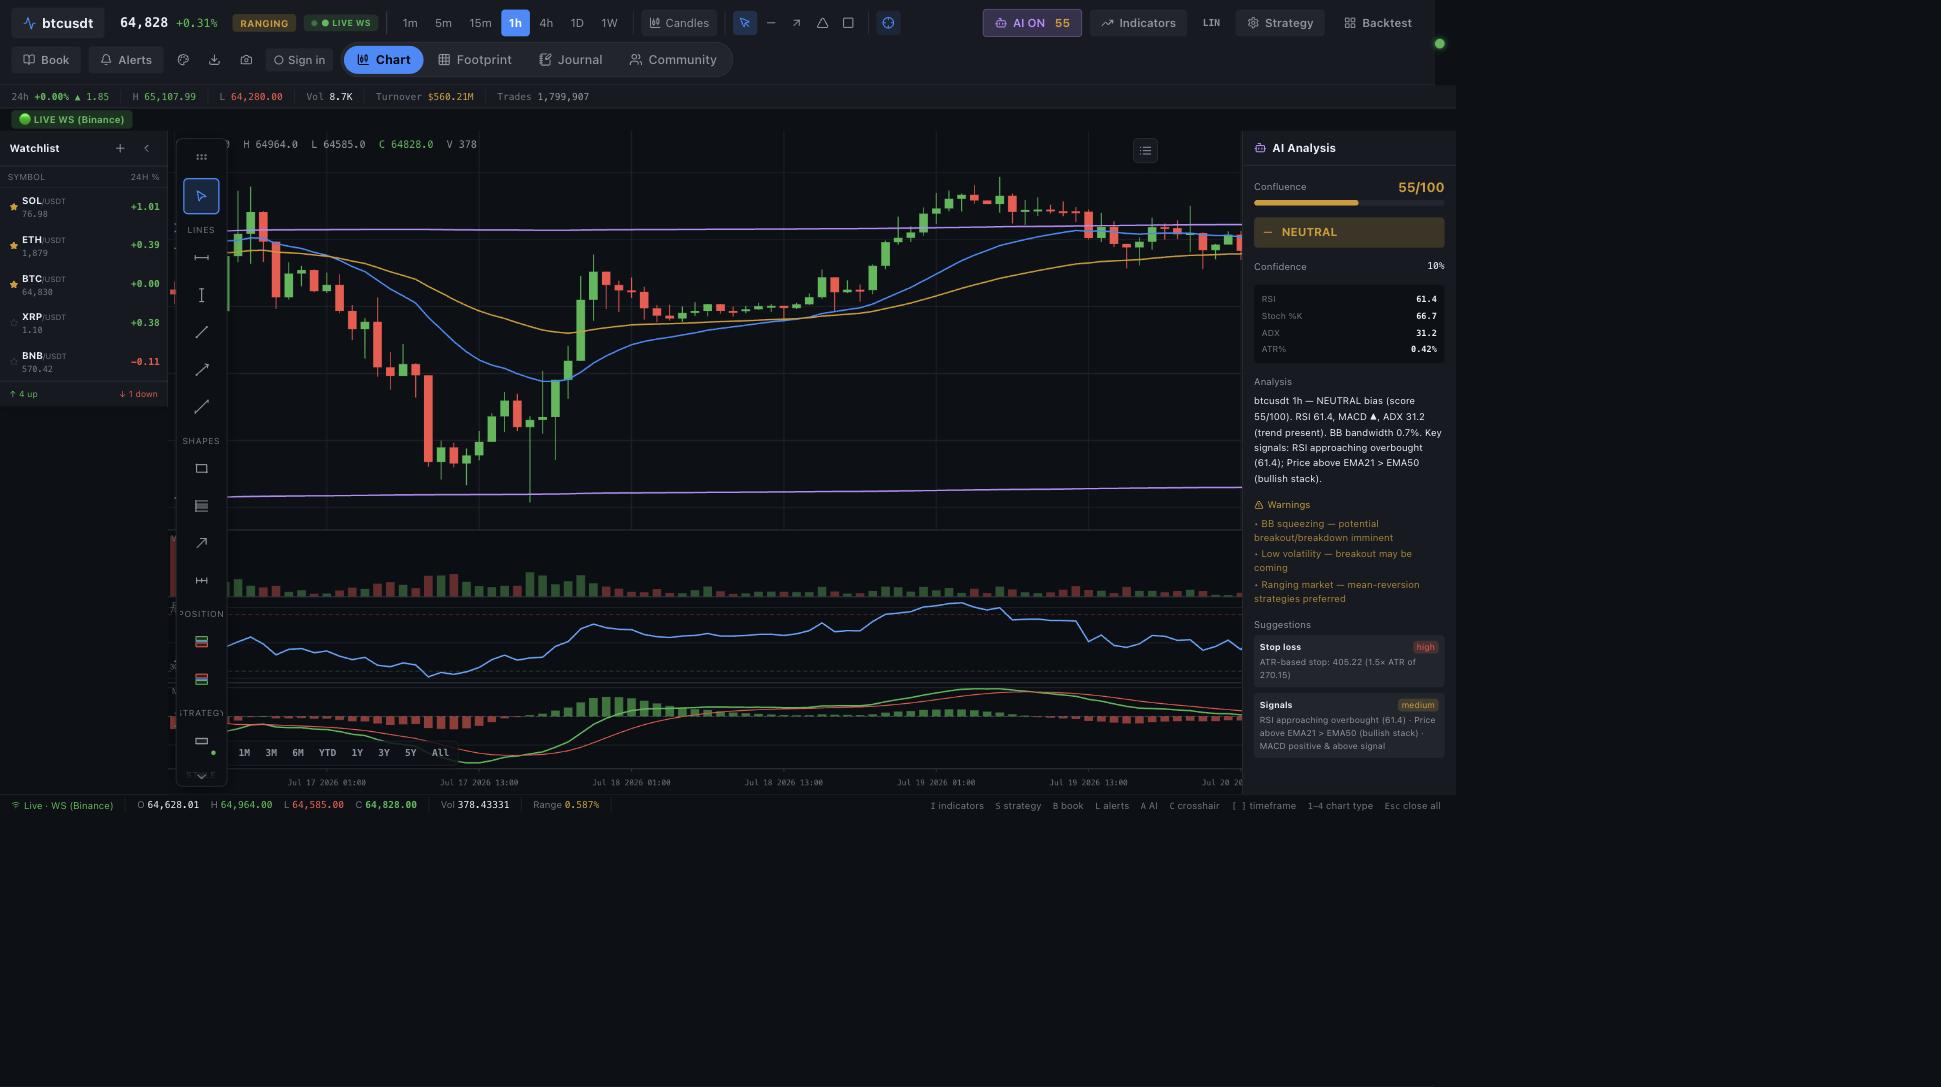
FIG. 03 — ODISEO, THE AI ANALYST
Confluence scored 0–100, regime warnings, ATR-based stop suggestions — read from the same candles you’re watching, inside the chart, not in another tab.
Analysis, not advice.
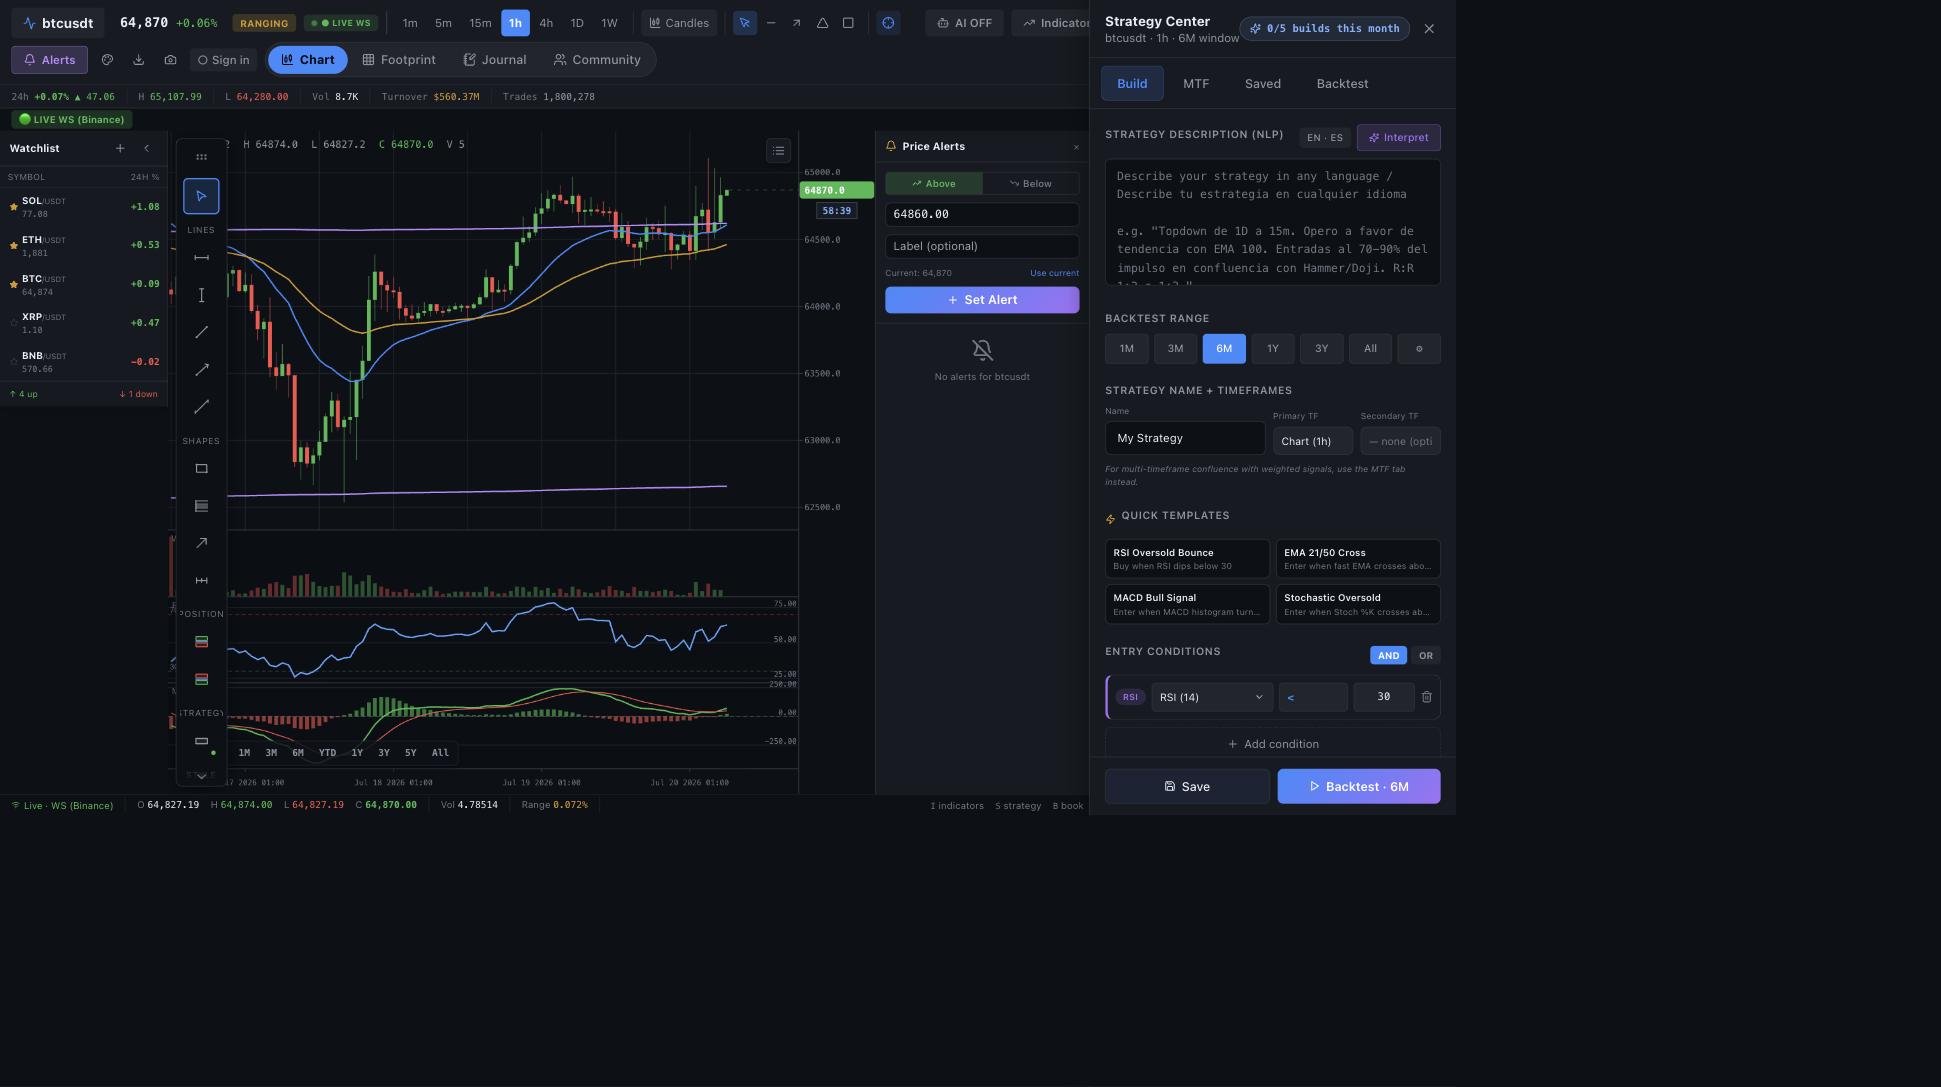
FIG. 04 — LIVE ALERTS
Alerts are checked against every live tick from the exchange feed — a browser notification and a bell the moment your level trades.
Every bar is a negotiation, and the footprint prints the transcript: executed bid×ask volume at every price inside every candle, imbalances flagged the moment one side overwhelms the other, delta and cumulative delta running underneath — live from the Binance futures feed, replayable bar by bar back to 2020.
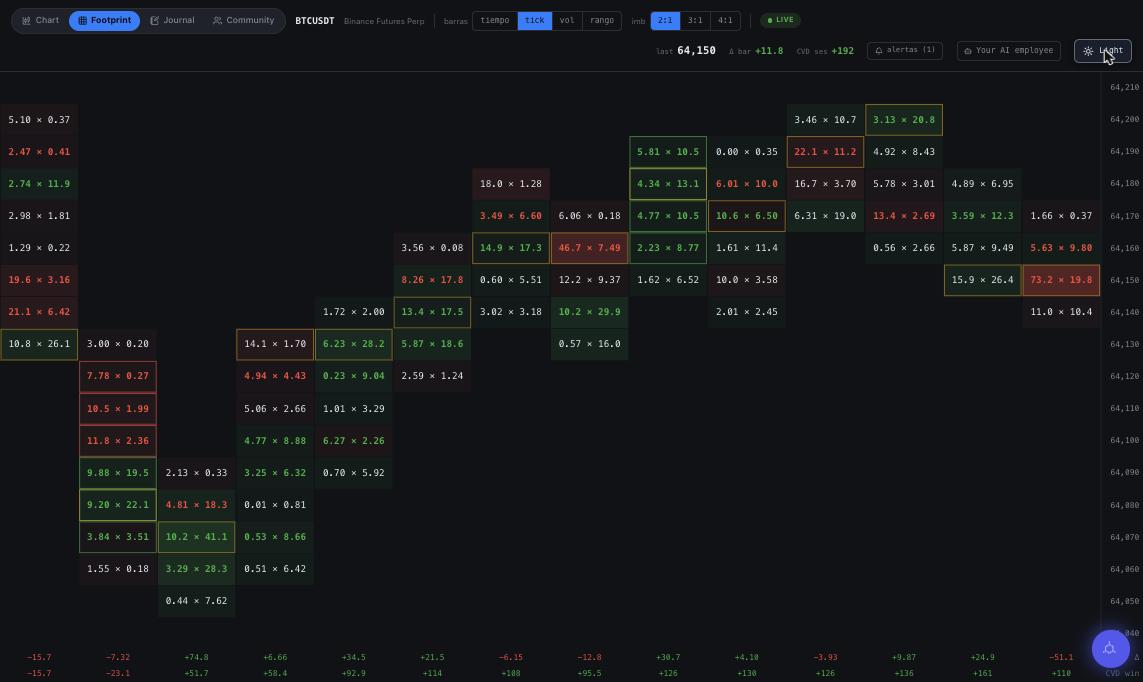
Executed volume at every price inside every bar — who lifted the offer, who hit the bid. Aggression, not intention.
Cells light green or red at 2:1, 3:1 or 4:1 the instant one side folds. Stacked flags mark the level that mattered.
Net aggression per bar and its running session total — price/CVD divergence on the chart, not in your head.
Arm alerts on order-flow conditions and backtest them like any indicator. Replay any session back to 2020.
SHIPS ON PRO & QUANT · TICK / TIME / VOLUME / RANGE BARS · POC PER BAR · ORDER-FLOW CONDITIONS FEED THE SAME ALERT + BACKTEST ENGINE
Type the strategy in English or Spanish — or start from a template. No code.
Run it against real Binance history — 2 years on Pro, back to January 2017 on Quant. Metrics in under a second.
Monte Carlo re-deals your trade sequence 500 times. Read the spread — best case, worst case, P5 — not the average.
Monte Carlo resampling re-orders your closed trades 500 times and maps every path — the lucky runs, the ugly runs, and the P5 tail you’d rather meet in software than in your account. You judge the strategy on the distribution, not on one fortunate curve.
Nexus Community is the social layer of the software. Publish a strategy and its backtest metrics travel with it — computed by the same engine that ran the test, never pasted from a screenshot.
The leaderboard ranks backtest metrics computed by the engine — in 3-month, 2-year and since-’17 leagues. No pasted PnL screenshots.
Published, verified work earns XP. Levels unlock flair and priority verification for your strategies.
Post analysis with the metrics attached, or a 24-hour story. Backtest numbers beat opinions.
Follow the traders worth reading, comment on their work, take it private in DMs.
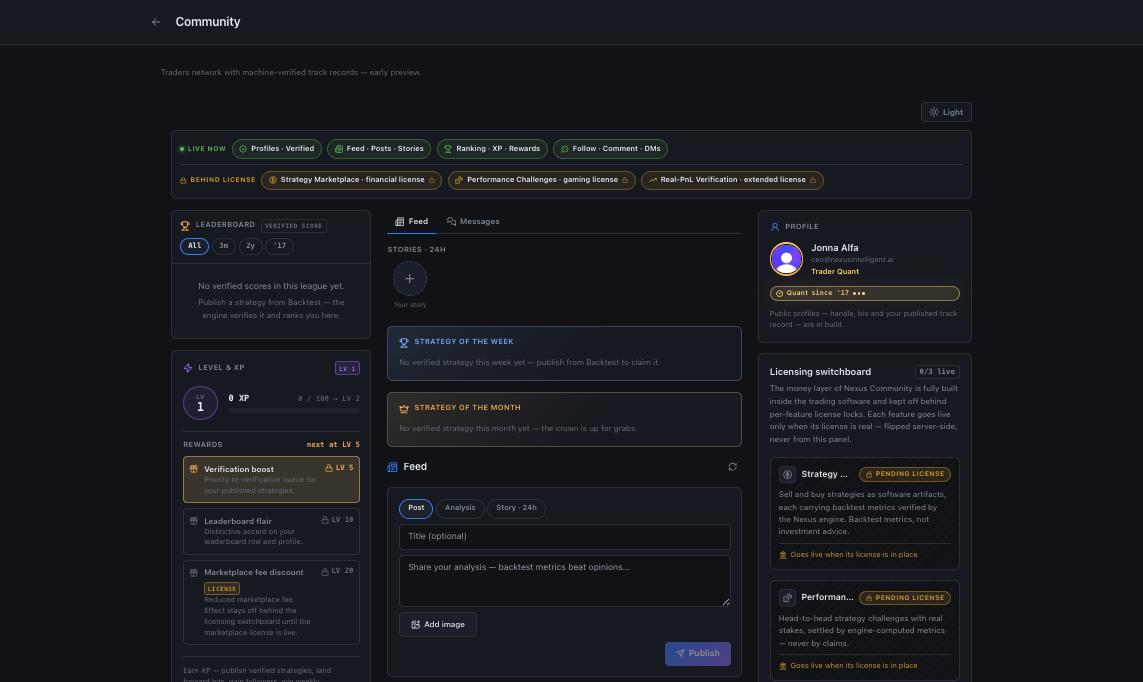
THE SOCIAL LAYER SHIPS FREE ON EVERY PLAN · STRATEGY MARKETPLACE & PRIZE CHALLENGES REMAIN SEALED BEHIND THEIR LICENSES — NOT AVAILABLE TODAY
Three plans. Early accounts take the founders rate — at public launch the same plans list at $29 and $79.
ISSUE — FREE
The open gallery.
No credit card required
ISSUE — PRO
The working trader’s desk.
— at launch $39/mo —
Upgrade in-app · cancel anytime
ISSUE — QUANT
The research bench.
— at launch $99/mo —
Upgrade in-app · cancel anytime
PRICES IN USD · ANNUAL BILLING (−25%) AVAILABLE IN-APP · FOUNDERS RATE FOR ACCOUNTS CREATED BEFORE PUBLIC LAUNCH
No. The Free plan is free forever and never asks for a card — start there. Upgrade to Pro or Quant whenever you want more; that is when a card is needed, billed monthly or annually and cancellable anytime. No trial to forget, nothing charged until you choose to upgrade.
No, and it never will under this license. Nexus Charts is trading analysis software: we chart, backtest and alert. We do not custody funds, place orders on any exchange, or connect to your exchange account for execution.
No. Everything in Nexus — including Odiseo, the AI analyst — is quantitative analysis of market data: readings, scores and scenario mathematics. What you do with it is your decision. Past performance does not guarantee future results.
Binance history back to January 2017 on Quant, a 2-year window on Pro, and a 3-month window on Free. Candles are stored server-side and stream into the chart as you pan.
Accounts created before public launch pay $10/mo for Pro and $17/mo for Quant. At public launch the same plans list at $29 and $79. No countdown theatrics — when launch happens, the founders rate closes.
No. Describe the strategy in plain English or Spanish — "buy when RSI dips below 30 and price sits above the 100 EMA" — and the builder turns the sentence into conditions, exits and risk, ready to backtest. Templates included if you prefer to start from one.
Order flow inside each candle. Every bar opens into executed bid×ask volume at every price, with cells flagged when one side overwhelms the other at 2:1, 3:1 or 4:1, plus per-bar delta and cumulative delta for the session — live from the Binance futures feed, replayable back to 2020. It ships on Pro and Quant, and order-flow conditions can drive alerts and backtests like any indicator.
The engine does. A strategy published to Nexus Community carries the backtest metrics computed by the Nexus engine on our servers — nothing self-reported, no PnL screenshots. Leaderboards rank engine-verified scores only. The Community is a place for analysis and discussion; it is not a signals service, and nothing in it is investment advice.
Crypto, on Binance market data, today. That focus is deliberate: depth over breadth. If you need stocks or FX charting, TradingView remains excellent at that.
Different instruments for different jobs. TradingView is superb general-purpose charting across every market, with the largest trading community on earth. Nexus is narrower and deeper: built for quantitative crypto work. Four things ship here that TradingView has no native equivalent for — Monte Carlo stress-testing (500 resampled runs on every backtest), order-flow footprint inside each candle (bid×ask, imbalances, delta and CVD, live and replayable), strategies written in plain English or Spanish instead of Pine Script, and Odiseo, an AI analyst reading the chart alongside you. Nexus also includes 146 indicators, unmetered on Pro and Quant.
Honestly: for most people, no — not yet, and not entirely. TradingView covers stocks, FX and futures; Nexus covers crypto on Binance data. TradingView has native mobile apps; Nexus is browser-first today. TradingView has millions of traders; our community is young. Where Nexus wins is the quantitative work: stress-testing a strategy before risking anything, reading order flow inside the candle, and building strategies without code. Plenty of traders run both. The Free plan is free forever and never asks for a card, so you can find out without cancelling anything.
Not natively, which is why both are core to Nexus. A single backtest tells you what happened in one ordering of your trades; a Monte Carlo resamples that sequence 500 times and shows the distribution of outcomes — including the drawdowns that one lucky run hid from you. The footprint splits every candle into executed volume at bid and ask per price level, flags imbalances at 2:1, 3:1 and 4:1, and tracks per-bar and cumulative delta. Footprint ships on Pro and Quant, and its conditions can drive alerts and backtests like any other indicator.
NEXUS CHARTS — SERIES 2026 · RAS AL KHAIMAH, UAE